Proof of a Landing That Never Happened
Hong Kong's Kai Tak airport closed in 1998. I went looking for the best possible way to land there, and ended up building something that mostly tells me what I don't know.
There is a piece of film that aviation people pass around like a family heirloom. A Boeing 747 comes in over Hong Kong at about the height of an apartment block, close enough that you can read the laundry on the balconies. Then, impossibly late, it banks right. Wings over rooftops. It straightens up a few seconds before the wheels touch, on a strip of concrete that runs out into Victoria Harbour.
Everyone who watches it says the same thing: that turn.
I watched it too many times, and I started noticing what nobody says. The turn is the famous part. The turn is not the landing.
Forty-seven degrees of inherited awkwardness
Kai Tak's Runway 13 had a problem that was never really solved, only managed.
The runway pointed at 135 degrees. The instrument guidance that brought you toward it pointed at 088 degrees. Those two numbers are 47 degrees apart, and that gap was not an oversight. It was there because the thing standing between the approach and the runway was a hill in Kowloon, with houses on it, and you cannot fly a straight line through a hill. So the procedure guided you politely past the problem, and then, at a few hundred feet, handed the aircraft back to the two people in the front seats.
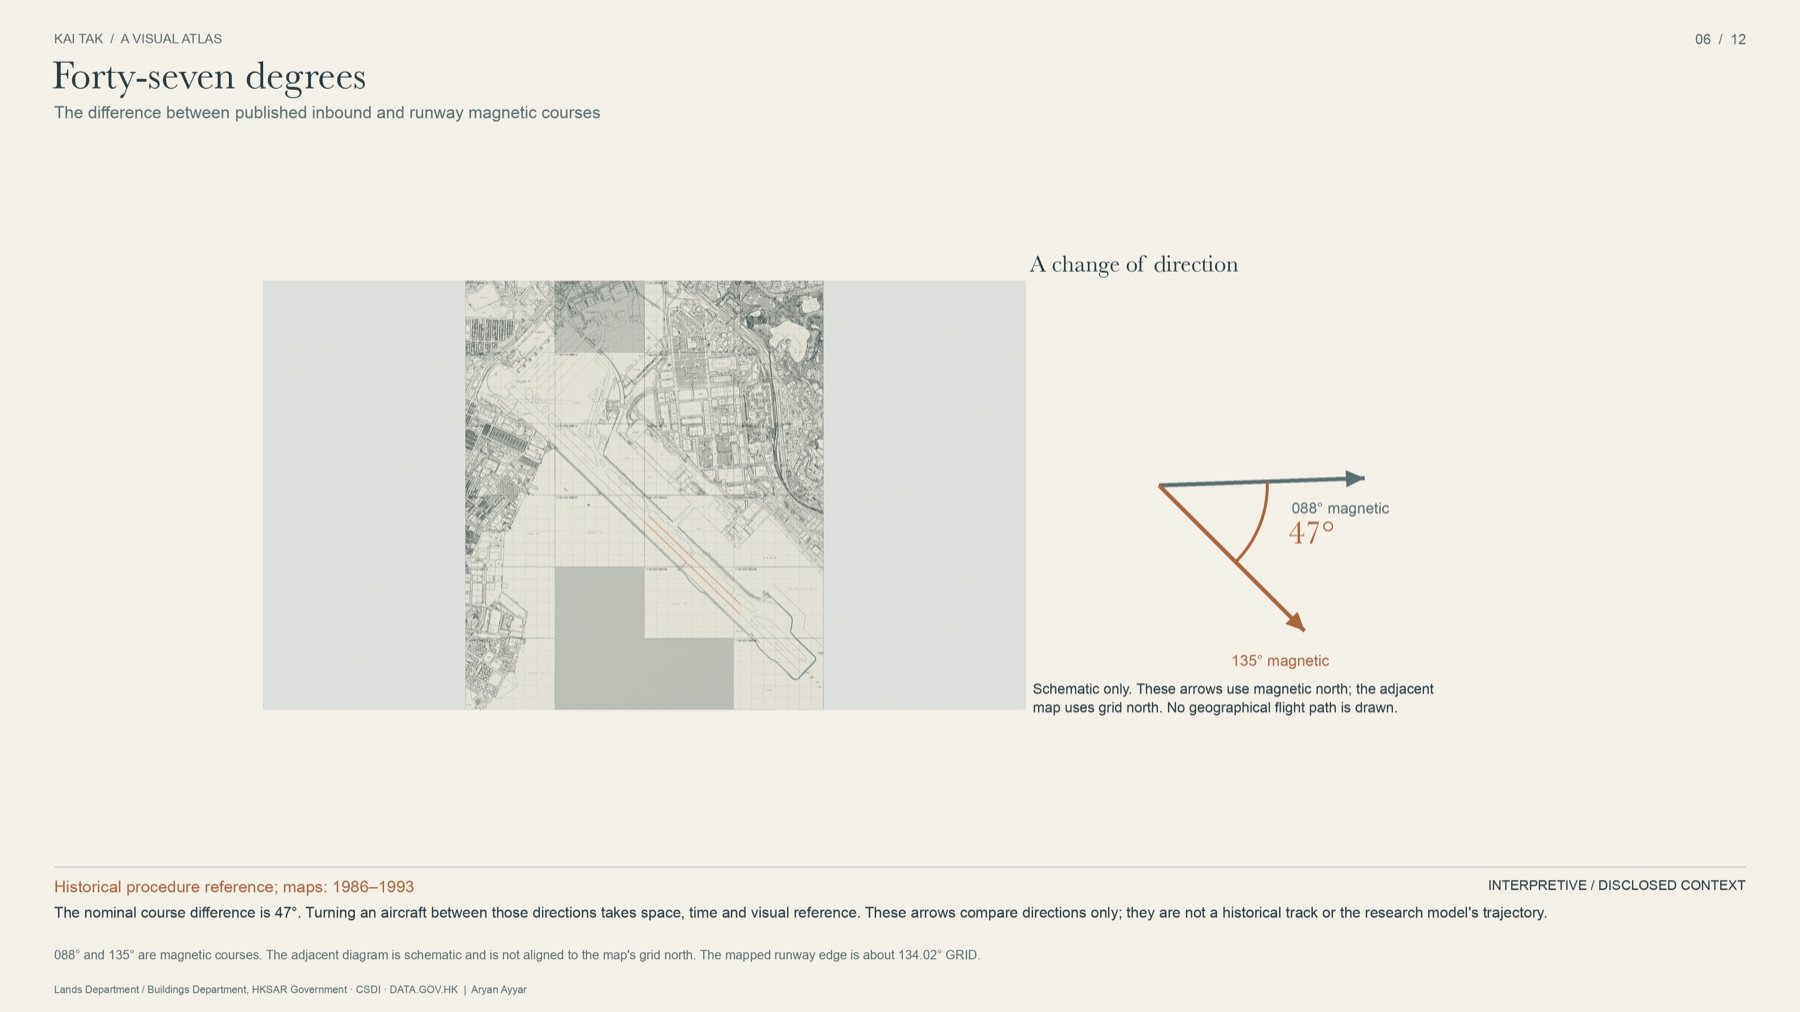
What those people had to do next was not in the chart. They had to see a giant orange-and-white checkerboard painted on the hillside, roll into the turn, hold it for a few seconds, come out of it wings-level and lined up, and still be descending at a rate that let them land where a runway of that length demands you land.
Here is the detail that hooked me, and that I have never seen stated plainly. The published procedure was strict about when to give up. If you reached a certain point without seeing the ground, you were required to abandon the approach. It was completely silent about how to finish. The hardest, most watched, most imitated manoeuvre in commercial aviation lived in the gap the regulations left open, and it lived there for decades on nothing but accumulated human skill.
Before going further, it is worth feeling how much room that turn actually needs. Bank the aircraft harder and the turn tightens, but the heading change still takes the time it takes. Those are two different quantities, and conflating them is the first mistake everyone makes.
So I asked what felt like an obvious question and turned out to be a hard one: what was the best possible way to do it?
Not "was it safe," which is a regulatory question and already answered. Not "did pilots do it well," which they demonstrably did. Something narrower and stranger. If you write down the turn, the descent, the touchdown and the stop as one single problem, with a hill behind you and water in front, is there a best solution? And if there is, could you prove it was the best, rather than just assert it?
I am not a pilot. I work on financial economics, which is a field obsessed with a very similar question: when is the information you can actually see enough to act on? I studied in Hong Kong, which is how an airport that closed when I was a toddler became something I kept circling back to.
What started as a weekend curiosity turned into a repository with an archive, a 38-page paper, a 3D reconstruction, twelve rendered plates and a mathematical note. Most of what I learned was not about aeroplanes.
You cannot model 1993 until you find it
The first thing that broke was my assumption that the past was available.
To put a mathematical landing over the real Kowloon, I needed the real Kowloon: where the buildings were in 1993, how tall they were, where exactly the runway threshold sat, how high the hill was. I went looking in government map archives, open-data portals, old survey sheets and aerial photography.
What I eventually had was 227 acquired map editions across 93 sheet locations, 48 full aerial photographic frames, weather records, and a catalogue of 3,268 artifacts across 44 datasets. I ran stereo photogrammetry over the historical aerial imagery and recovered a surface of the city: around 171,000 three-dimensional points and 225,000 triangles of 1993 Kowloon, reconstructed from photographs taken while the place still existed.
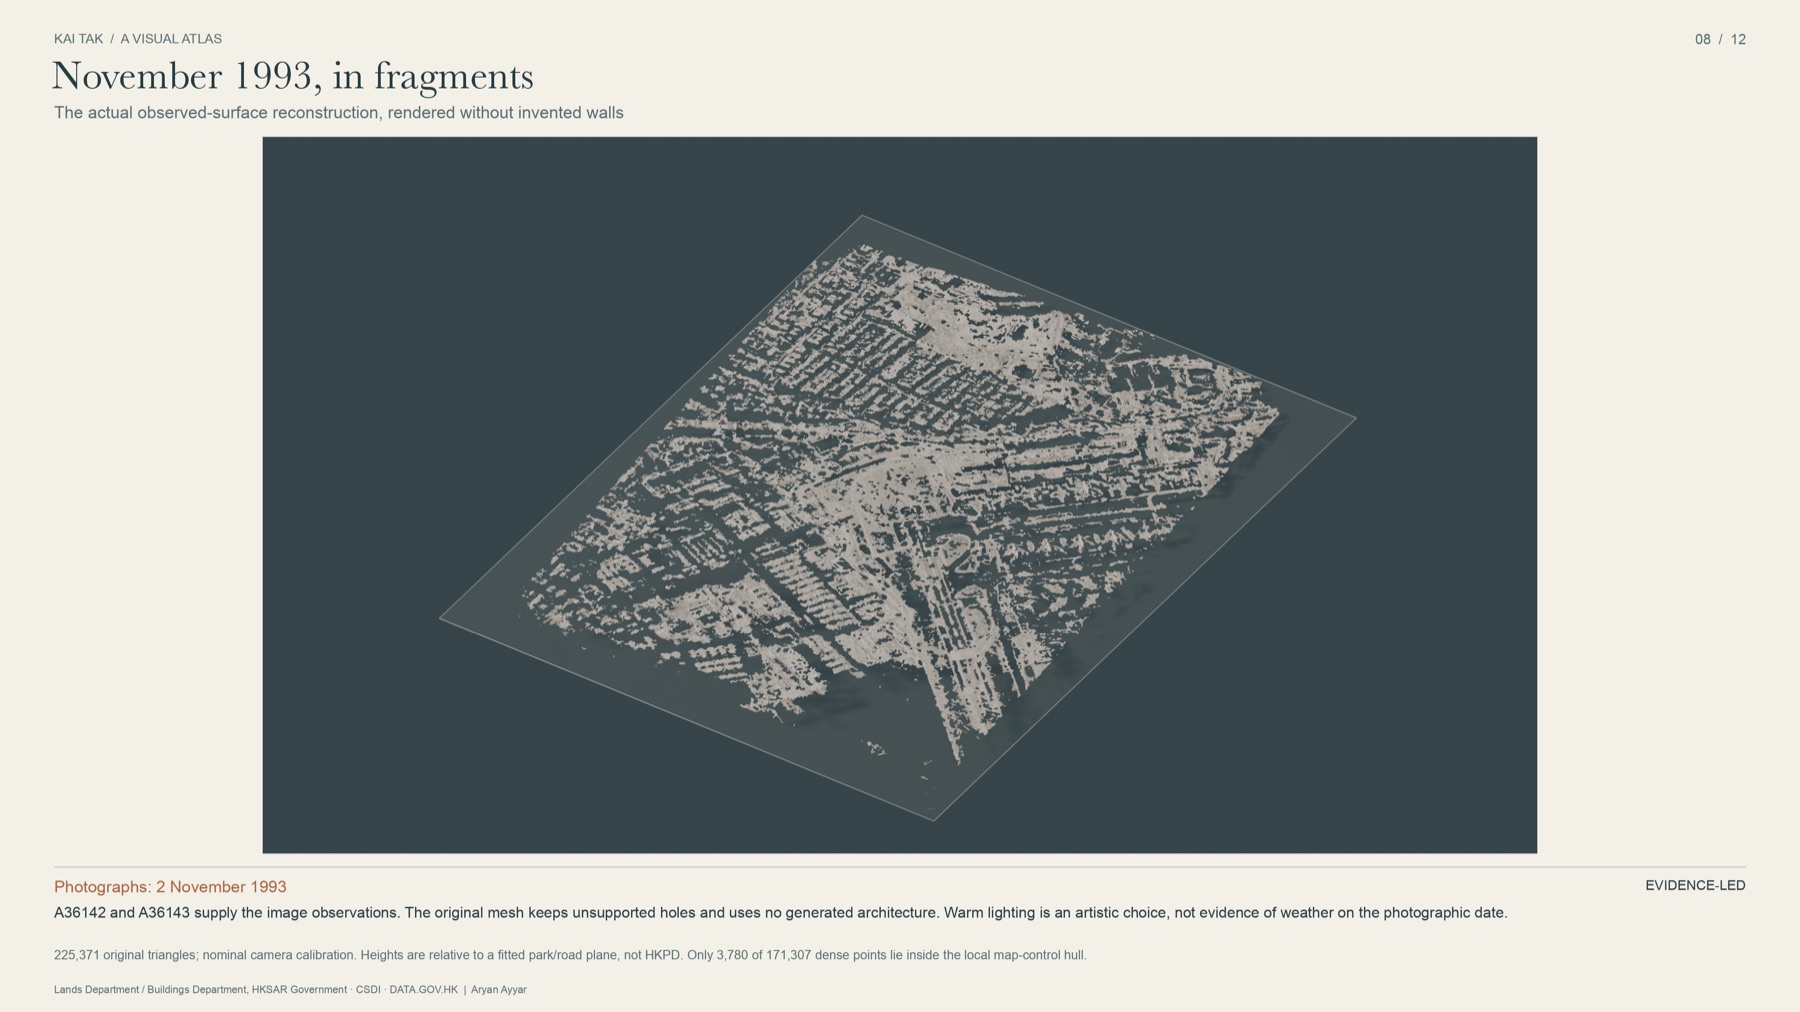
Those two source photographs are dated the second of November, 1993. Hold that date for a moment. It becomes relevant two sections from now.
The surface has holes in it. Real ones, where the stereo matching found nothing, and you can see straight through the city.
I left them.
That decision sounds small and it is actually the whole project. The easy move, the one every 3D tool nudges you toward, is to close the holes. Fill the gaps, smooth the surface, and you get something that looks like Kowloon in 1993. It would also be a lie with a pleasant finish. Forty-five of the building faces I reviewed have unknown heights. I could have given them plausible ones. Instead they are recorded as unknown, and the model refuses to produce a clearance result for any region where it does not actually know what was standing there.

One of my favourite small failures: I picked a road intersection as a control point to tie the maps to the photographs, and discovered the road had been rebuilt between the two. The control was wrong. I threw it out and left the earlier result in place, labelled. Another: a tighter aircraft shape I derived from manufacturer drawings came out shorter than the manufacturer's own published maximum height for that aircraft. That is arithmetically impossible, so the shape was wrong. It is still in the repository, marked rejected.
And the one that still bothers me. There are two defensible ways to register the runway onto the historical maps, one working from the northern end and one from the southern. They disagree about where the threshold was.
of disagreement about where the runway began, on a problem whose entire argument turns on where you touch down.
I did not average them. Averaging two disagreeing measurements produces a third number with no evidence behind it and the false comfort of a single answer. Both fits are published, both are labelled as unaccepted, and the historical part of the model does not run. It has a dedicated code path whose entire job is to decline: you ask it for a historically calibrated answer, and it writes out a structured record explaining exactly which evidence is missing and exits with an error.
I wrote a program whose most reliable output is "I don't know." It is tested. The refusal works.
The fourth of November
There is one landing at Kai Tak that is documented to the second, and it is the one that went wrong.
On 4 November 1993, the tail of a typhoon was over Hong Kong. A 747 came down Runway 13, touched late and fast, and did not stop. It went off the end into the harbour, where it sat with its tail above the water. Everyone on board got out.
Two days earlier, a survey aircraft had photographed Kowloon from above. Those are the frames the reconstruction above is built from. The city in that model is the city as it stood forty-eight hours before.
The official investigation explains what happened. I was not trying to re-litigate it. I wanted the one thing it uniquely offered: a real landing on that runway with real numbers attached, against which an idealised mathematical landing could be measured.
Start with the arithmetic of stopping, which is almost insultingly simple. You touch down somewhere past the threshold. For about two seconds nothing much happens while the braking takes effect. Then you decelerate at some rate until you stop. Three terms. The runway either contains them or it does not.
Here is that calculation, with the research model's own fixed assumptions. Move the two sliders and watch the runway budget rearrange itself.
The last preset is the one that stays with me. Those are the touchdown position and speed the investigation states, dropped into a formula that otherwise does not change. Nothing exotic happens. The numbers simply stop fitting.
Then I did something almost childishly simple. Instead of asking what happened, I asked, at each moment of the rollout: from here, how hard would you have to brake to stop by the end?
Read that progression again. The aircraft was decelerating the entire time, and the braking it needed was rising the entire time.
I know of no more compact lesson in what margin actually means. Your speed is falling, every instrument agrees you are slowing, and the situation is getting worse, because the runway is being consumed faster than the energy is. At one checkpoint, roughly 65% of the runway had been used while roughly 63% of the touchdown kinetic energy was still there. Nothing about that is visible in "we're slowing down."
conditional_stopping_cases.csv and rollout_trace.csv.
Underlying values digitised from CAD Report 1/95; the primary report is not
redistributed.
And then the weather fell apart too
The airport had five wind sensors, printing three fields each. I transcribed every printed row: 225 direction-and-speed pairs across 15 timestamps. One sensor, at one moment, reported a present-wind of 37 knots, a two-minute average of 23, and a ten-minute average of 19. Same instrument, same instant, three legitimate answers 18 knots apart, depending only on how long a window you chose to average over.
Across sensors it was worse.
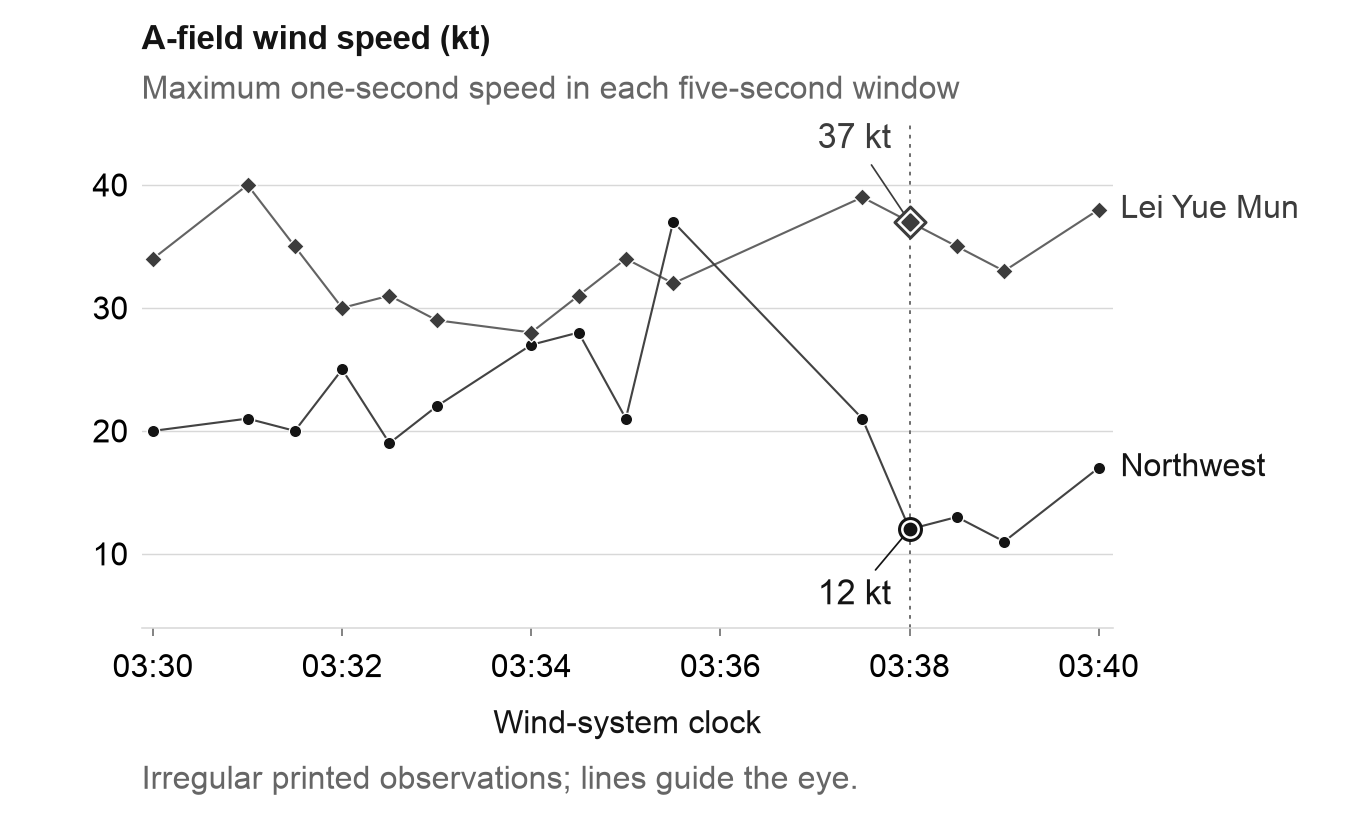
And the printout, because it only fired on events, missed the peaks. We know a 44-knot gust was recorded. It is not in any row we have. We cannot place it on the flight's timeline, and we never will.
For context: of the comparable routine weather reports in the archive, about 99% were calmer than that night. Not a probability, not a forecast. Just a reminder of where in the distribution this one documented landing sits.
The shape of a proof
Now the part I set out to do, with the mathematics left in the paper.
Write down a landing as twelve numbers: how long the turn takes, how fast you cross the threshold, where you aim to touch down, the shape of the descent, the shape of the flare, and so on. Each candidate landing has margins. Clearance over the ground. Bank angle against its limit. Thrust against its limit. Runway left over at the stop. Each margin is a distance from something going wrong.
The obvious thing to optimise would be fuel, or time, or smoothness. I optimised something else: the weakest margin. Of everything that could go wrong on this landing, find whichever is closest to going wrong, and push that one as far from the edge as possible. Then do it again, because once you fix the worst thing, something else becomes the worst thing.
That is not a mathematical convenience. It is what a good landing is, and it is what a careful person means when they say an approach felt tight. Obstacle clearance in this model is not a cost you can trade away for better performance. It is a wall.
The widget below is a toy, and labelled as one. But it does carry the idea that took me longest to internalise: you cannot improve a landing by improving a margin. You can only improve it by improving the worst margin, and the worst margin keeps changing identity underneath you.
Doing this properly produces a landing that touches down a few hundred metres beyond the threshold and stops with about 254 metres of concrete left. That is roughly three and a half 747 lengths of nothing-went-wrong.
Then there is the question of whether it is the best one, which is where it gets interesting.
The argument is geometric and I think it is beautiful even stripped of notation. At the solution, six of the margins are simultaneously critical. Each one has a direction in which it gets worse. The proof shows those directions surround you. Not loosely: the point you are standing on sits strictly inside the shape they span. So every direction you could move, every adjustment to the flare, every variation at all, makes at least one of those six margins worse immediately.
You are on a summit. Not because every path down has been walked, but because there is provably no direction that goes up.
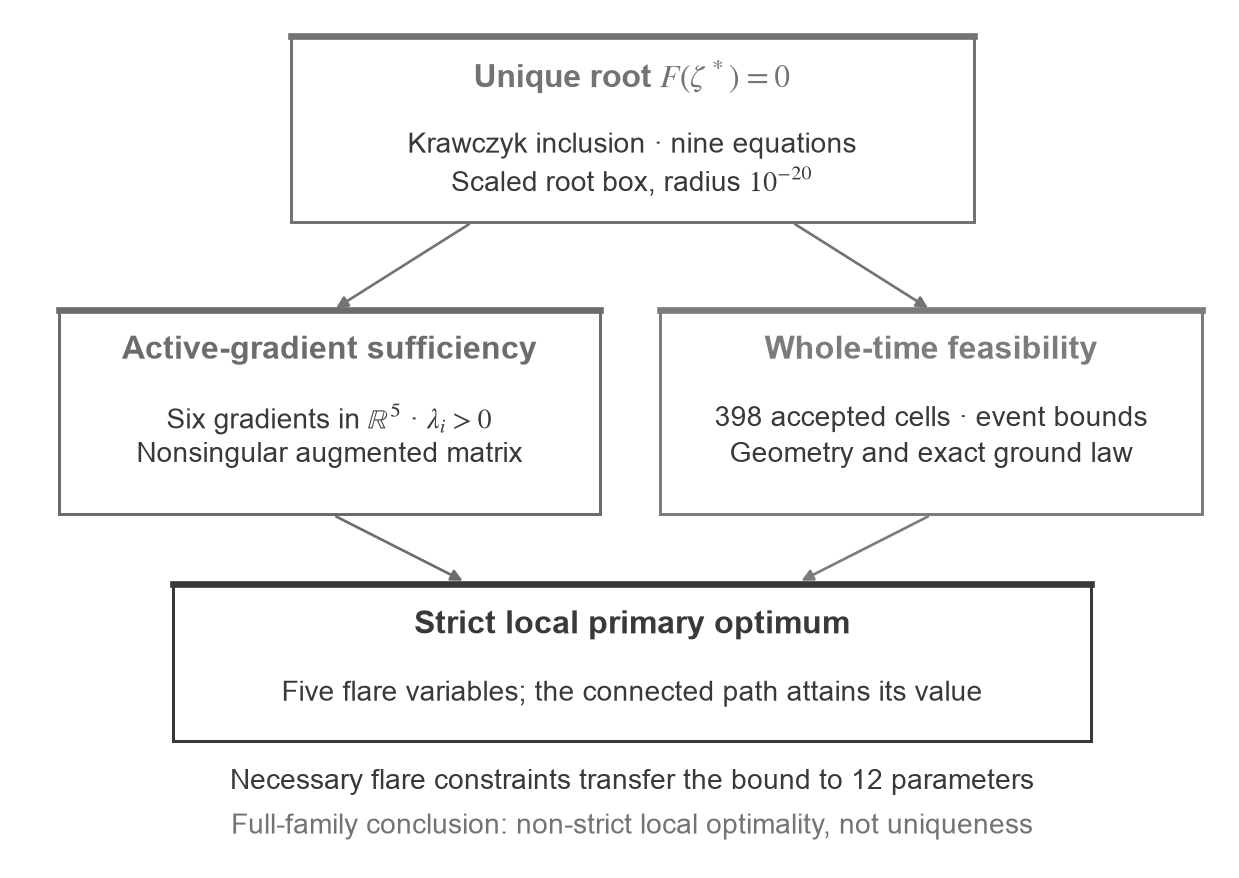
That is a real result, verified with arithmetic that rounds outward at every step so the conclusion survives the computer's own rounding. It is also, and I want to be precise about this, a statement about a hilltop.
I also computed a ceiling for the best landing anywhere in the whole family. The hilltop sits at about 0.152 on the margin scale. The ceiling is about 0.182. Those two numbers do not meet.
Which means there may be a better landing somewhere I haven't been, and I cannot currently rule it out. The gap between 0.152 and 0.182 is the honest size of my ignorance, written down where anyone can see it.
What is still open
Most research writing hides this list in a final paragraph called limitations, where it can be safely skipped. I would rather put it where it belongs, because it is the part of the project that is still alive. Every item below is something I would change my published claims for, if the evidence turned up.
The live ledger
Four things I cannot currently settle, and what would settle them.
-
evidence
Where the runway threshold actually was. Northern and southern registrations disagree by 81.5 m. A survey from November 1993 with coordinate and height control is identified but its numerical schedule is missing. Finding that schedule would close it.
-
evidence
How tall the buildings on the hill were. Forty-five reviewed map faces still carry unknown heights, and no complete dated obstacle volume exists. Until that changes, the model will keep refusing to produce a historical clearance result, which is the correct behaviour and still a gap.
-
mathematics
Whether a better landing exists. Certified at 0.1523607643, bounded above at 0.181970215. Closing that bracket, or finding something inside it, is an open problem anyone can pick up. The certificate and its derivation are public.
-
unresolved
Three conditions that did not resolve at all. A 5-knot tailwind, and urban heights of 60 m and 65 m. Each is listed as unresolved rather than quietly dropped, because a case you could not solve is a result, and a case you deleted is not.
None of this is a reconstruction of a historical flight. None of it is a verdict on any pilot. None of it is operational guidance, and nobody should fly anything on it.
What I came away with is a different way of looking at competence.
The Kai Tak turn is remembered as a feat of nerve, and it was. But what those crews were actually doing, continuously, without a chart to help them, was managing a whole system of margins at once: clearance, speed, alignment, energy, the runway behind them and the water ahead. The folklore kept the nerve and lost the bookkeeping. I spent a long time building the bookkeeping, and my clearest finding is how much of it the pilots were carrying in their heads.
There is one more thing I like, in a slightly rueful way.
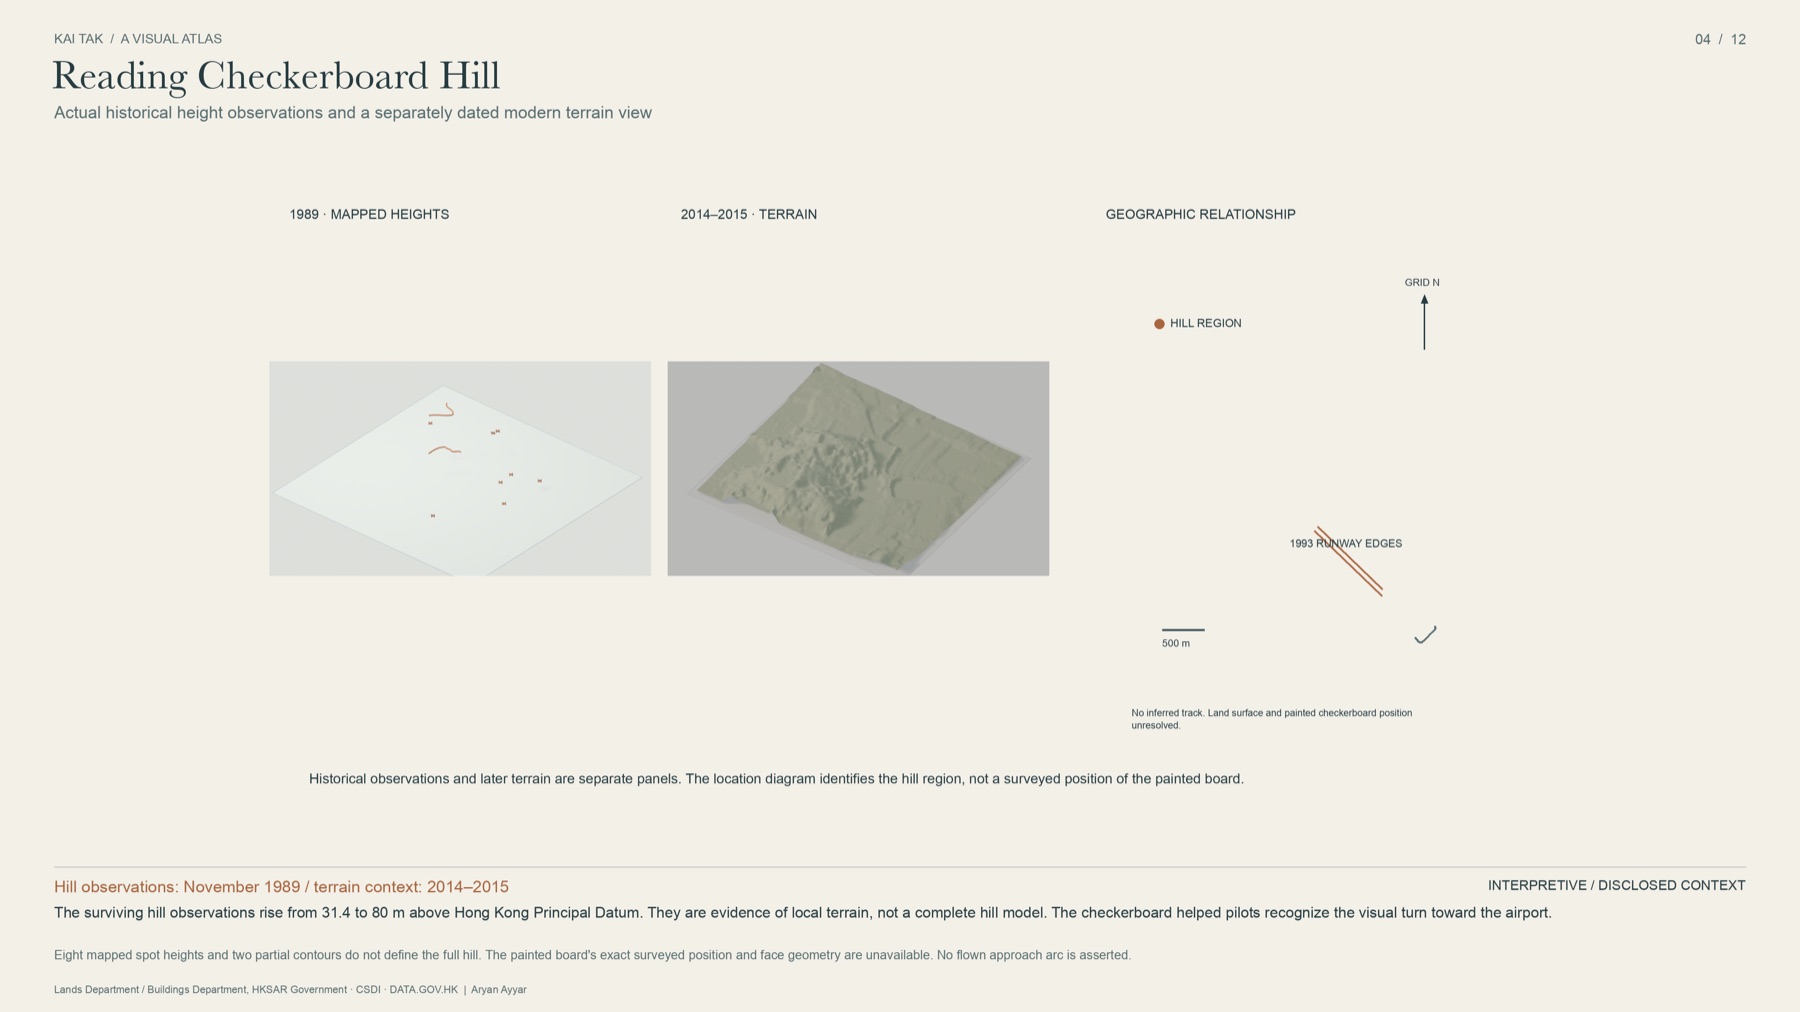
The checkerboard on the hill is the most famous object in this entire story. It is the cue the whole manoeuvre hung on, the thing every pilot looked for and every passenger photographed. I have 227 map editions, 48 aerial frames and a certified optimality proof.
I still cannot tell you exactly where it was.
The whole project is public: the 38-page paper, the historical archive, the 3D visual atlas, the proof certificate, and every labelled failure along the way.
github.com/ayyararyan/kai-tak · Read the white paper (PDF, 38 pages) · Project page
This is independent research, built with AI assistance for implementation, drafting, figures and checks. It has not been through specialist peer review, and no source institution endorses it. Historical maps and imagery remain the property of the Lands Department and Buildings Department of the Hong Kong SAR Government, reached through the CSDI Portal and DATA.GOV.HK. If you know Kai Tak, the archives, or the mathematics better than I do, I would genuinely like to hear where I am wrong.
Tell me where I'm wrong
This is the part I actually want.
If you flew into Kai Tak, worked with the Hong Kong survey archives, or know the optimisation literature better than I do, I would rather hear a correction than a compliment. Every item on the ledger above is there because someone could close it, and some of them will be closed by a person who simply knows where a document is filed.
Open an issue on the repository ↗ for anything specific: a wrong number, a missing source, a better bound. Write to me for anything else.